![]()
![]()
![]()
![]()
![]()
![]()
|
|
| [an error occurred while processing this directive] |
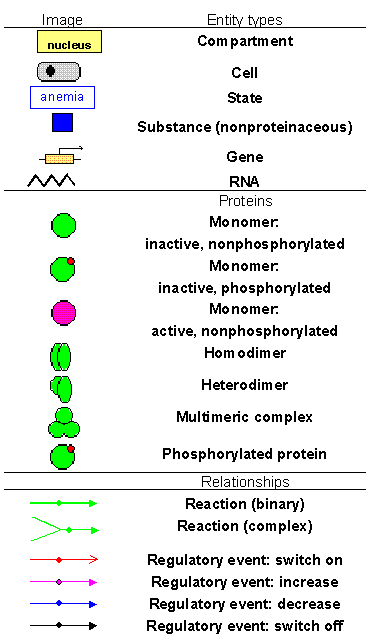
Images of gene network componentsEach object type in the GeneNet database has its own image in the diagram, representing the features of the object (Table 1). The shape of the protein indicates the level of its multimerizaton; color, its functional state (active or inactive); and an additional red ball, its modification resulting from phosphorylation. The arrows, which represent the relations between the objects, differ depending on their type (Table 1): reaction is indicated by a green arrow. The color indicates type of the regulatory event: red, switch on of the reaction; black, switch off of the reaction; pink, positive effect on the reaction; and blue, negative effect on the reaction. Table I.Images of gene network components
|