Program description:
The program is designed for estimation of symbolic data compression.
Access to the program: Complexity.
List of biological tasks that could be solved by using the program for estimation of stochastic complexity:
Technical task:
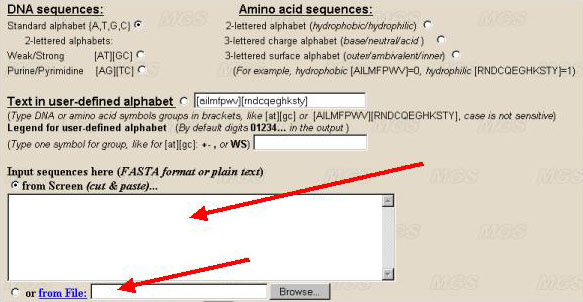
Data input:
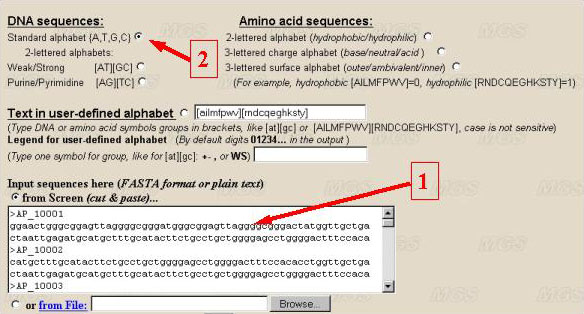
The sequence to be analyzed should be entered into the text-box in the FASTA-format. The divisor between separate sequences is the line with the first symbol '>'. The sequence can be entered from file of the user's computer by clicking the option 'From file'.
If there is only a single sequence to be analysed, you may input this sequence in a plain text format without the comment line. The program has no formal limitations for a sequence length. It is recommended to analyse sequence not less than 500 bp.
Program options:
Let us determine the alphabet. If it is necessary to analyse DNA sequence, choose the alphabet for analysis of the text. It is possible to use the nucleotide symbols {A, T, G, C} (the standard alphabet, by default) (number 1 in the figure), or their combinations (for example, A/T, G/C} for studying GC-content in binary alphabet (number 2 and 3). A user may use another combination of letters by choosing the option 'User defined alphabet'. Then a user may set in a text-box the alphabet (number 7), for example, in a form [AT][GC] or [TC][AG], or A[CGT]. The symbols in square brackets are interpreted as a single symbol. The symbols that are not indicated in alphabet will be ignored.
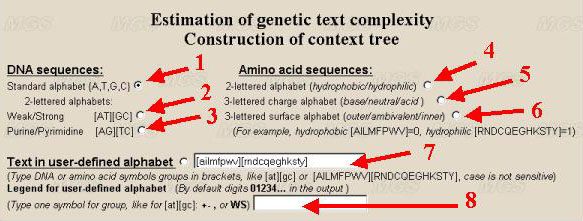
To analyse amino acid sequences, choose the alphabet for analysis of the protein sequence. In this case, the parameters of nucleotide alphabet are ignored. The program searches for the contexts in the alphabet with the length up to 5 symbols. That is why 20 symbols denoting amino acid residues should be united in the groups. We suggest the following variants of grouping of 20 residues: by hydrophobicity-hydrophilicity (number 4 in the figure), by charge (number 5), by location (inner positioning or the surface one; number 6). A user may order his own variant of partitioning by ordering in appropriate window the line indicating how to group the symbols (number 7). By ordering by a user of his own alphabet, the residues that are not indicated will be ignored. In case the alphabet of more than 5 symbols is ordered, the estimation of complexity will be incorrect. User can define own legend for alphabet symbols to put it in graphic file (number 8). For example, {A,T,G,C} could be presented in the program output as {0,1,2,3}. Hydrophobic and hydrophilic amino acid residues could be presented as '+' and '-' in the resulting picture. By default program makes standard one-lettered designations for DNA and amino acid groups (numbers 1-6) and digits 0,1,2,3... for user-defined alphabet (number 7).
Only a single type of the alphabet should be chosen (see numbers 1-7).
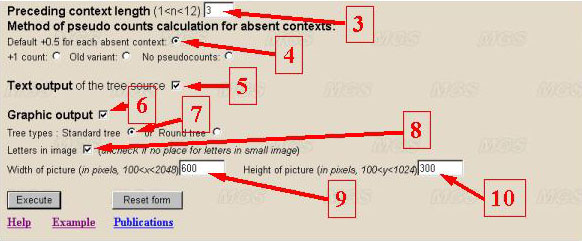
The program parameters are ordered as indicated by arrows in the figure given below:
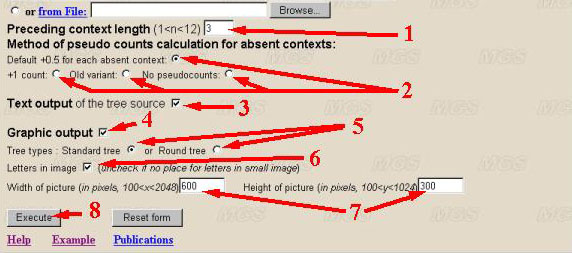
(1) The context length could vary from 2 to 12. The default value is 3. This is the length of the maximal context significant for generation of the symbol (dimension of the Markov model). It is recommended to input the maximal value of a parameter equalling to 10.
(2) Method of pseudo counts calculation for contexts absent in sequence could be one of the following: add 0.5 to each absent context (by default); add 1 to each absent context; old variant (release 1.1, add 0.5 to each absent context and calculate the penalty function by another way); not add any pseudo counts for absent contexts. In practice, there is no difference for long sequences (several Kb), but for shorter ones source tree could have more branches.
(3) By default the check box 'Text report' is set and the program displays the complete statistical data in a textual form. Since these data may have a large volume (it exceeds 4d contexts, where 'd' is the context length), user may discard this option.
(4) To display the graphical data output, select the appropriate check box. Select the form of graphical representation of the prefix context tree.
(5) By default, the tree with suspended vertexes (leaves) is ordered ('Standard tree'). The contexts are read from top to the bottom or from leaves to the root. This corresponds to disposition of contexts in the sequence from the left to the right (for DNA, from 5' to 3' end; for proteins, from N- to C-end). A user may choose the tree representation in a form of the radial tree. This representation is more compact. In this case, the contexts are read from outer surface to the centre (root of a tree).
(6) Additional parameters for the tree representation set the data output without denotation of vertexes (without letters) for simplicity. By default, the graphical output is displayed with the letters from the alphabet ordered by a user. If the alphabet is not standard, the symbols are replaced by natural numbers, i.e., 1, 2, 3 etc.
(7) A user may also set the options for the scale of graphical representation or to make the picture less for more convenient copying from screen and further usage. The absolute size of the picture by height and width in pixels are set in appropriate text-boxes. The maximal size is limited by resolution of the computer screen. It is recommended to set the size of at least 200 pixels.
Program execution:
The program is executed by clicking the button 'Execute' (see number 8 in figure given above).
Data output:
The program outputs the results in a textual or graphical format as was indicated by a user, by means of clicking the check boxes 2 or 3 shown in the figure above. The program displays in the text format the value of complexity for a sequence entered and a set of selected contexts with their frequencies. Short example of the data output:
Set context len:3
Set: Show all statistics
Set legend for alphabet:
Set model: Rissanen +0.5 pseudo count model
>AP_10001
-------------- Data information --------------
Alphabet       size:4
Alphabet   contains:ATGC
Context      lenght:3
Number of contextes:64
Complexity         :15976.343353
This is tree
in pseudographics (0-absent, 1-present)
/treebegin 4 ATGC
1
1111
1111000011111111
0000000000000000000000000000000000000000000011111111000011110000
(File size without comments) Length=8142+(  2)
Standard compressed file size=2035.5000
Complexity[0][0]=15976.3434
Direct calculation=16243.1322 (Compression = 0.9836)
Entropy=-SUM p*log(p) =1.9927 (*n=16224.3197)
Full context tree complexity (3 levels)=16049.4487 (Compression relative to full tree=0.9954)

+86.492+90.015+303.119+212.223+177.096+88.669+213.017+228.685+292.880+355.262+366.817+290.590+940.399+563.361+973.922+1082.446+1166.418+1243.845+1452.686+914.056+1272.908+3661.437
 Control complexity sum of leaves 15976.3434 == 15976.3434

--Control complexity sum of leaves 0.0000 == 15976.3434

 Context - Variability - Complexity
/contextbegin
GCAA= 24
GCAT= 19
GCAG= 56
GCAC= 22
. . .
User can copy and paste such output (all text file or part from "/contextbegin" to the end of file) to the VMM program
http://wwwmgs.bionet.nsc.ru/mgs/programs/vmm/VMM.html
In a graphical representation, the visualization of the context tree in a standard or radial form is displayed as a GIF-file. An example of representation of the context tree in a standard form is given below:
The same context tree could be represented in a radial form: The same in radial form without letters on leaves:
Let us consider the task of searching for context dependencies in the set of AP-1 binding sites (32 kB, Eukaryotic Transcription Factor Binding Sites Compilation - http://wwwmgs.bionet.nsc.ru/mgs/dbases/nsamples/).
Enter this set in a FASTA-format into the input text box (step 1).
Set the standard alphabet {A, T, G, C} (step 2).
Set all the parameters by default.
Set the context length equal to 3 (step 3 in the figure below).
Set the method to count for absent contexts (step 4).
Set the textual output of contexts (step 5).
Set the graphic mode of the output data (step 6).
Set tree type as a standard tree (step 7).
Set parameter 'letters in image' equal to 'Yes' (step 8).
Set maximal width of the picture equal to 600 pixels (step 9).
Set maximal height of the picture equal to 300 pixels (step 10).
Then press button "Execute".
The results of the program execution will be displayed as the figure shown:
As seen from the figure, for the sequence considered, the statistically significant are the dinucleotides of the form NA, NG, NC, where N=A/T/G/C. In addition there are NCG, NAC, NGC trinucleotides. This fact should be taken into account for constructing recognition programs. User can copy and paste text output only to the VMM program http://wwwmgs.bionet.nsc.ru/mgs/programs/vmm/VMM.html to construct prediction profile.
Comments and questions are welcome to mailto: orlov AT bionet.nsc.ru.