Correlation network representation and analysis
(Isoelectric point value characteristic)
First, we have detected clusters of positions that are highly
correlated. A set of the protein positions, each position displaying a significant
correlation with at least one position from the set, was considered a cluster of
correlated positions.
To detect such clusters of correlated positions, we applied the hierarchical clustering
approach. We clustered all the positions basing on the following measure of correlation
for a pair of positions i, j:
![]() ,
,
Robust estimates for partial correlation coefficients were used.
This is tree representation of the correlation networks between homeodomen positions. Red
vertical lines corresponds to critical values of the correlation coefficients.
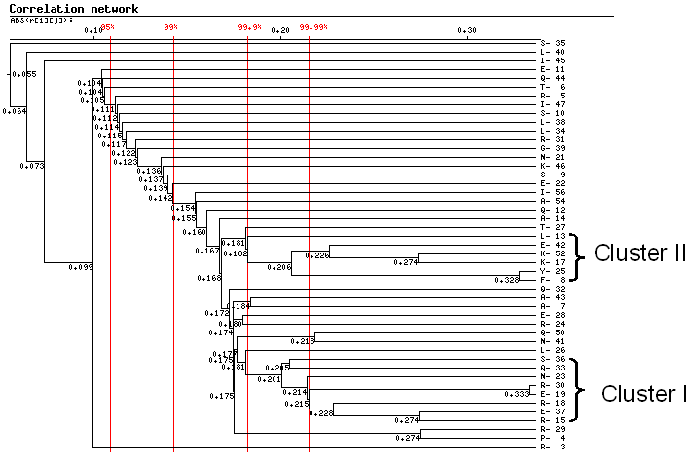
Two networks (clusters) were selected.
| Network | Positions |
| I | R15, R18, E19,N23, R30, Q33, S36, E37 |
| II | F8,Y25, L13,K17,E42,K52 |
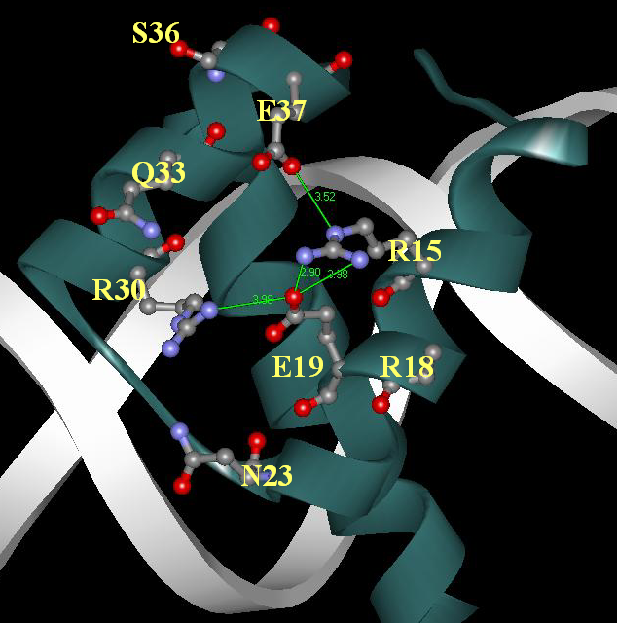
Cluster I
Localization of residues in a spatial structure of DNA-homeodomain complex [ PDB ID: 1HDD; Kissinger et al [3]). Green lines correspond to sald bridges (distance between charged atoms of opposite sign < 4 A):
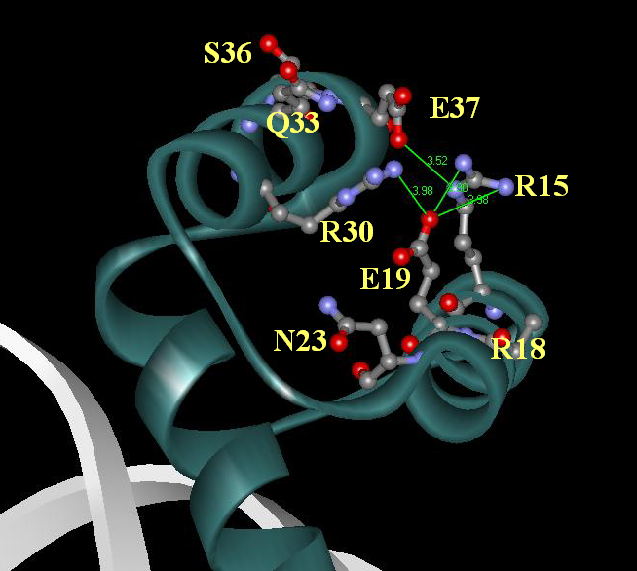
Another representation of this cluster of residues:
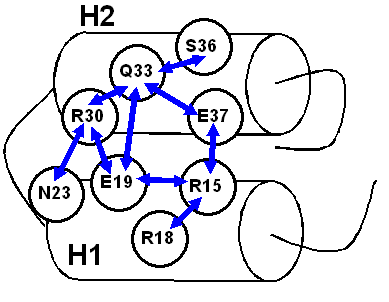
Schematic representation of the correlation network for cluster 1 (blue arrows - significantly negatively correlating pairs):
Analysis of the QI characteristic dispersion
M=105 random samples of normal independent variables were generated with parameters corresponding mean and dispersion estimates in real homeodomain sample. The distribution parameters of QI dispersion in random samples were estimated as follows:
F |
|
|
|
|
QI |
80.72 |
127.74 |
128.09 |
100000 |
![]() - number
of random samples with the dispersion value of the QI greater than in
original sample.
- number
of random samples with the dispersion value of the QI greater than in
original sample.
Distributions of the dispersion values of the characteristics QI in
simulated random samples with independent changes in pI values at individual positions
within homeodomain: x axis, Drand; y axis, fraction of
samples with the corresponding Drand value; arrows indicate the
dispersion values at homeodomain positions.
Therefore it may be concluded that characteristic QI is conserved with the confidence greater than 99.99%.
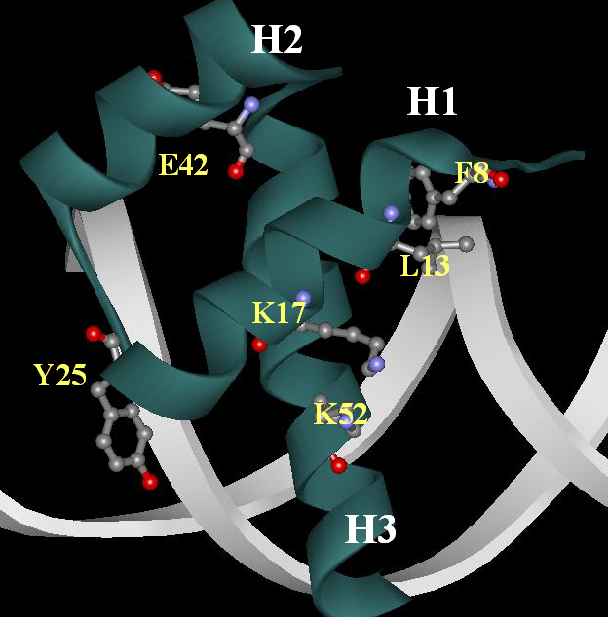
Cluster II
Localization of residues in a spatial structure of DNA-homeodomain complex [ PDB ID: 1HDC; Kissinger et al [3]):
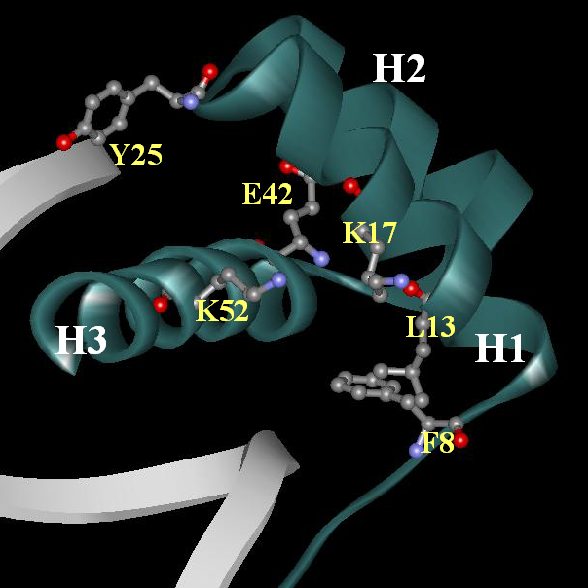
Another representation of this cluster of residues:
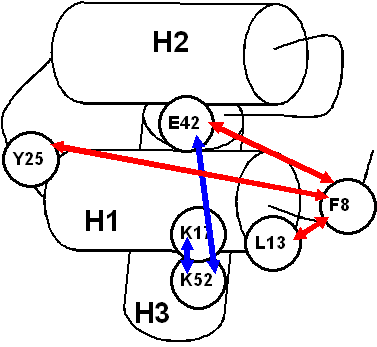
Schematic representation of the correlation network for cluster 1 (blue arrows - significantly negatively correlating pairs, red arrows - significantly positively correlating pairs):
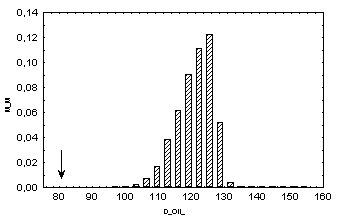
Analysis of the QII characteristic dispersion
M=105 random samples of normal independent variables were generated with parameters corresponding mean and dispersion estimates in real homeodomain sample. The distribution parameters of QI dispersion in random samples were estimated as follows:
F |
|
|
|
|
QII |
16.17 |
18.94 |
18.99 |
98339 |
Distributions of the dispersion values of the characteristics QII in simulated random samples with independent changes in pI values at individual positions within homeodomain: x axis, Drand; y axis, fraction of samples with the corresponding Drand value; arrows indicate the dispersion values at homeodomain positions.
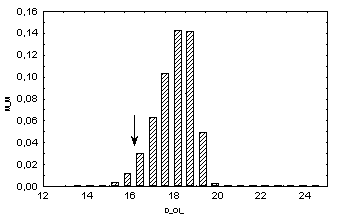
Therefore it may be concluded that characteristic QII is conserved with the confidence greater than 95%.