|
(1) |
CRASP |
Program overview |
The CRASP package was developed to analyze correlated residue substitutions in multiple sequence alignments of a protein family. We proceeded on the assumption that the functionally related pairs of amino acid residues might have evolved dependently and vice versa, the co-ordinated mutations at certain protein positions can reveal the functionally important interactions between the residues at these positions. In particular, some of the detected correlations are presumably compensatory because of the proximity of the residues at the correlated positions. To date, a range of methods for the detection and analysis of coordinated residue substitutions have been developed. With our approach, such correlations were analyzed in terms of the physicochemical property values. We believe that these characteristics reflect physical and chemical interactions between residues.
The CRASP package uses multiple alignments of protein sequences as input data and performs analysis of three kinds. First, it allows estimating correlations between residue substitutions at pairs of protein positions. Second, it allows estimating the Pearson's correlation coefficient and the linear functional regression equation for the physicochemical value at a position pair. Third, it analyzes integral physicochemical protein characteristics that involve groups of protein positions. The package enables to use the information on pairwise positional correlations for deducing conserved (or extremely variable) integral protein characteristics. Below, we describe the methods and algorithms implemented by the CRASP package. The calculation parameters are given in the Help Information files.
Pairwise correlation estimation.
(We also refer to the statistics textbooks: Anderson, 1958; Kendall and Stuart, 1967).
The first step of analysis performed by the CRASP package is the estimation of the pairwise correlation of residue substitutions at protein positions. The approach is based on estimation of the linear correlation coefficients between the amino acid physicochemical property values.
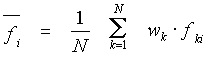
In a sample of N aligned sequences of the length L, a value of the user-selected property f is attributed to every amino acid in the alignment. As a result, a matrix, whose elements fki are the values of a property at the i-th position of the k-th sequence, is calculated.
The mean value of a physicochemical property at the position i is estimated as:
|
(1) |
where wk is the weight of a
sequence (see Data
weighting),![]() .
.
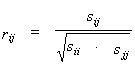
The covariation sij (i ![]() j) and variance (if i=j) are estimated as:
j) and variance (if i=j) are estimated as:
|
(2) |
To estimate the relation between the values of physicochemical property values at the position pairs fi and fj, the linear correlation coefficient is used:
|
(3) |
where sij are the elements of the covariation matrix S. The positive (negative) correlation coefficients for the position pair of i,j suggest that if the f value increases due to mutation at the i position, a substitution causing an increase (or a decrease) in the f value is likely to occur at the other position j.
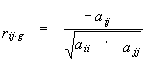
Additionally, the software CRASP allows estimating the pairwise partial correlation coefficients (this measure is also termed as the refined or the conditional correlation coefficient). For the set of random variables that follow the Gaussian distribution, these coefficients allow estimating the direct interaction between variable pairs, i.e. it estimates the conditional relationship between two variables provided that all the other g=L-2 variables remain fixed. In the CRASP package the coefficients are estimated by the equation:
|
(4) |
where aij are the elements i,j of the matrix inverse to the covariation matrix. For detailed information on the partial correlation coefficients estimation see Anderson, 1958; Kendall and Stuart, 1967.
The results of CRASP's estimation of the pairwise positional correlations are represented as an LxL matrix of the corresponding values (correlation or partial correlation). The user can change the Type of the matrix parameter to specify the type of the calculated matrix.
To represent highly correlated pairs of positions, the threshold value rc is calculated by the CRASP package. For the linear correlation coefficient and under the assumption of Gaussian distribution of the f values throughout the independent alignment positions in the case of |rij|<rc, the residue substitutions at positions i,j can be considered as statistically independent. The following statistics is applied to estimate rc.
|
(5) |
The t value follows the Student's t-distribution with m=N-2 degrees of freedom (Kendall and Stuart, 1967), where N is the number of sequences in the alignment. For the partial correlation coefficient (4), the degree of freedom in equation (5) is equal to m = N-L. This equation allows estimating the critical value of the correlation coefficient rc by applying the tP value of Student's statistics at the given significance level P. In the CRASP package, the values rc for the representation of highly correlated pairs are chosen by the Significance level parameter.
With the CRASP package approach, information on correlation coefficients for the amino acids physicochemical properties is used for detecting the conserved (or extremely variable) integral characteristics of a protein.
Integral characteristics of proteins
Homologous proteins possess various conserved features, physicochemical characteristics that remained constant in an evolving protein family. For example, such characteristics might have be protein hydrophobic core volume, net charge of a spatially close group of residues in an active site, hydrophobic moment of an alpha-helix, etc. These characteristics might have been of functional or structural importance for the family of homologous proteins. Therefore, information on such characteristics would shed light on the specificities of functional interactions between amino acid residues of the queried proteins. For example, it would facilitate predictions of the functional motifs in protein (Eisenhaber et al, 1998).
Two possible mechanisms might have provided the constancy of these characteristics. One is the conservation of residues at certain protein positions. This mechanism is frequently used to infer functionally important protein residues from their conservation estimates.
The second is of particular interest and may be an "extension" of the first, acting when residues at certain positions vary, but the protein characteristic related to the positions varies slightly, if at all. This mechanism implies correlated amino acid substitutions: the constancy of characteristic here is provided by a coordinated residue substitutions (the so-called "compensatory mutations"). The characteristic constancy here means that its variation value in a sample of homologous sequences is significantly less than expected for the independent amino acid substitutions. The feasibility of the second mechanism has been examined for the constancy of the protein hydrophobic core volume (Lim and Ptitsyn, 1970; Ptitsyn and Volkenstein, 1986; Gerstein et al., 1994).
In the CRASP package the case of the integral characteristic F is considered, the linear. It is defined as a linear combination of a physicochemical property value at protein positions, for example, for the alignment sequence with the index k:
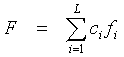 ,
,
where ci are arbitrary numbers. This definition represents a broad class of protein physicochemical characteristics, such as protein hydrophobic core volume (total volume values of the residues that form the hydrophobic core), net charge of the protein residues in an active site; projection of the alpha- helical hydrophobic moment, etc. In the CRASP package the Characteristic Description parameter describes the integral characteristics the user provides. The parameter allows to specify the values ci for protein positions.
As a measure of the conservation of the value F for a set of protein family sequences, the variation D(F) is used (Lim and Ptitsyn, 1970; Gerstein et al., 1994):
![]() ,
,
where the mean value ![]() is
defined as:
is
defined as:
![]() .
.
The CRASP enables to use the information on the pairwise positional correlations to detect conserved (or extremely variable) integral characteristics of proteins. Currently, this step of analysis is not automated and the integral characteristic is the user's choice. The underlying idea is described below.
Let us consider two protein positions i and j. Let Di and Dj, be the variations in a physicochemical property f at these positions, respectively, and rij be the correlation coefficient between the values fi and fj. The variation in the sum of these values can be calculated as:
![]() .
.
Hence, if the correlation coefficient is negative, the variation in the sum of the values fi and fj, decreases. Similarly, if the correlation coefficient is positive, the variation in the difference between the values fi and fj decreases. As for the group of positions that mainly yield negative pairwise correlation coefficients, the total value f over these positions is expected to be less than in the case of random amino acid substitutions at these positions.
After the inference of the physicochemical integral characteristic, its constancy relative to the independent substitution model can be compared. The CRASP package enables the user to compare the D(F) values for a queried protein set with those for the independent substitution model. This makes it possible to estimate directly the impact of co-ordinated residue substitutions on the constancy maintenance of the integral physicochemical protein characteristics.
The variance of an integral characteristic F is defined as the sum of two components
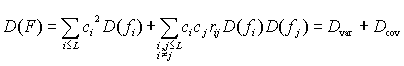 ,
,
where D(fi) is the variation in the property f at position i, rij is the correlation coefficient for the property for the position pair i,j. It is easy to see that Dvar is dependent on the variability in protein positions and Dcov is dependent on the coordinated substitutions. Note, Dvar is always 0 or greater, whereas Dcov can be positive, negative or zero. The latter can be used as the null hypothesis for testing the significance of the contribution of coordinated substitutions to D(F). In this case (for all rij=0), the expected variance of the physicochemical characteristic is
![]() .
.
Coordinated substitutions contribute to the stability of the integral characteristic F, if D(F)<Dexp(F). To test this inequality for significance, the variance ratio l= Dexp(F)/D(F) is used, thus, l serves as a characteristic of the contribution of coordinated substitutions to the variation in the integral characteristic F. At l > 1, the contribution narrows the variation range (increases conservation); at l < 1 it widens the variation range (increases variability). At l�1, the contribution of coordinated substitutions is insignificant. It is known that l obeys the Fisher's F distribution with the L(N-1) and N-1 degrees of freedom, where N is the number of sequences (Selvin,1998). Therefore, the percentile points of the F distribution can be used for the estimation of the significance of the deviation of l from 1.
Additionally, the Monte-Carlo simulation is applied to test for significance the observed deviation of the variance D from Dexp(F). M random samples are generated. There are no pairwise dependencies of the physicochemical characteristic values of the residues (rij=0). Every sample consists of N sets of Gaussian distributed independent numbers with the means and variances equal to the estimates at each analyzed position. Then, the variation Drand(F) for such random samples is calculated and the number m of the samples with Drand > D is counted. The ratio m/M is an estimate of the significance of the deviation of D(F) from Dexp(F). In the course of the Monte-Carlo simulation, the lrand=Dexp(F)/Drand(F) value is calculated for every random sample, using the D(fi) value in a random sample to estimate Dexp(F). The proportion of random samples with l>lrand is the estimate of the significant contribution of the coordinated substitution to the constancy of the F characteristic.In case of several integral characteristics Fi , the software CRASP allows estimating the parameters of their mutual distributions. The correlation coefficient r(Fi,Fj) is estimated from the expressions (1-3) using Fki instead of fki (where i is the index of the integral characteristic). The regression parameters for the linear relationships between Fi and Fj,
|
(6) |
are calculated, too.
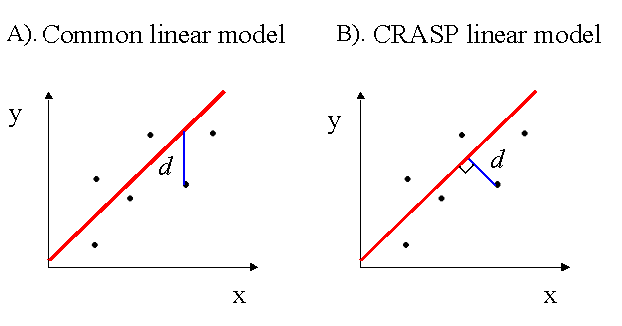
In our case, estimation of the linear regression parameters differs from the commonly used regression y=a* x+b. The latter defines the relation between the independent variable � (is not subject to random errors) and the dependent variable �. In this model, the regression line minimizes the sum of the standard deviations of the y values from the observed values.
In our case, both the variables Fi and Fj are prone to deviate randomly. Moreover, we suggest the functional relationship model between these values, the relationship expressed asf(Fi ,Fj )=const,
where f(Fi,Fj) is a linear function. Therefore, the regression parameters in (6) minimize the sum of the square distances d from the observed points to the regression line, that is, the lengths of perpendiculars dropped from the points on the line (Kendall and Stuart, 1967), see difference in the figure below for common (A) and functional regression (B). For the parameter a of a linear regression (6), we also estimate its 95% confidence limits (Kendall and Stuart, 1967).
The amino acid sequences of homologous proteins are the products of molecular evolution, they were related through shared ancestry at different stages of evolution, and consequently were interdependent. Their common ancestry can bias statistical estimates. To avoid the bias, different methods of sequence weighting were proposed (Vingron and Argos, 1985; Altschul et al., 1989; Gerstein et al., 1994, Henikoff and Henikoff, 1994). The CRASP package enables to apply different data weightings: 1) all the sequence weights are equal to 1 (no weights applied); 2) by default, Vingron and Argos ( 1985) weighting is selected; 3) Felsenstein (1985) approach (which requires information on the phylogenetic tree); 4) Henikoff and Henikoff (1994) weighting algorithm; 5) the weight coefficients introduced by the user;
Briefly, the Felsenstein's approach is based on the assumption that the later the organisms had diverged from their common ancestor during evolution, the stronger the dependence between homologous protein sequences from two organisms (Felsenstein, 1973).
Vingron and Argos (1985) have suggested a simpler approach by using weights for sequences given by![]() ,
,
where wi is the
weight of the i-th sequence and Dik is the distance
between the i- th and the k-th sequences. The distance measure
is simply the number of different amino acids in two sequences. All the weights
are normalized to the N - number of sequences, i.e.![]() .
.
Henikoff and Henikoff (1994) have suggested weights based on the diversity of each position in alignment.
Networks ( clusters) of correlated positions
The relationship between the protein positions relative to their pairwise correlations is also described by a binary tree. We clustered all the positions basing on the following measure of closeness for a pair of positions i,j:
![]() ,
,
i.e., the stronger the correlation between two positions in a protein, the smaller this distance. The nearest neighbor method was used for clustering. The results were described by a binary tree. Each node of the tree unites two sets of positions (the vertical branches from the node) and the position of a node on the dendrogram corresponds to the maximum correlation coefficient between all the possible pairs. Thus, both the pairs of correlated positions and the position groups where substitutions occur dependently can be identified. This diagram, in principle, allows identifying sets of the positions within a protein, each significantly correlated to one at least position from the set. Therefore, these sets of positions are conceived as networks of correlated positions. We suggest that the linear combinations of the amino acid physicochemical properties values in networks of highly correlated positions can be good candidates for the conserved characteristics of proteins.
Correlation matrix higher density regions
The CRASP package allows detecting the correlation matrix regions where significant correlated pairs prevail (within the square window of the user-defined size). In this case, the probability p that the expected number of significant pairs in the window would exceed the observed value m is expressed as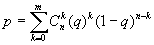 ,
,
where q is the proportion of significant correlation pairs for the entire matrix, n is the number of matrix elements in the window, m is the number of significant matrix element in a window. The prevalence of significant correlation of different sign (positive only, negative only or both) can be estimated. Thus, this region was considered as significant if p < 1% (at a P=99%). The regions of higher prevalence of significant correlation are shown in a separate diagram as matrix elements with magenta coloured borders.
Literature cited
Altschul,S.F., Carroll,R.J. and Lipman,D.J. (1989) Weights for data related by a tree. J. Mol. Biol., 207, 647-653.
Anderson, T.W. (1958) An Introduction to Multivariate Statistical Analysis, Wiley, New York.
Clarke,N.D. (1995) Covariation of residues in homeodomain sequence family. Prot. Sci., 4, 2269-2278.
Eisenhaber,B., Bork,P., Eisenhaber F. (1998) Sequence properties of GPI-anchored proteins near the omega-site: constraints for the polypeptide binding site of the putative transamidase. Protein Eng., 11, 1155-1161
Felsenstein J. (1973) Maximum-likelihood estimation of evolutionary trees from continuous characters. Am. J. Hum. Genet., 25, 471-492.
Felsenstein,J. (1985) Phylogenies and the comparative method. Am. Nat., 125, 1-15.
Henikoff,S., Henikoff,J.G. (1994) Position-based sequence weights. J. Mol. Biol., 243, 574-578.
Gerstein,M., Sonnhammer,E.L. and Chothia,C. (1994) Volume changes in protein evolution. J. Mol. Biol., 236, 1076-1078.
Kendall,M.G. and Stuart,A. (1967) The advanced theory of statistics. Vol. 2. Inference and relationship. 2nd edition. Charles Griffin & Co Ltd., London.
Korber,B.T.M., Farber,R.M., Wolpert,D.H. and Lapedes,A.S. (1993) Covariation of mutations in the V3 loop of human immunodeficiency virus type 1 envelope protein: an information theoretic analysis. Proc. Natl. Acad. Sci USA, 90, 7176-7180.
Lim,V.I. and Ptitsyn,O.B. (1970) On the constancy of the hydrophobic nucleus volume in molecules of myoglobins and hemoglobins. Mol. Biol. (USSR), 4, 372-382.
Neher,E. (1994) How frequent are correlated changes in families of protein sequences? Proc. Natl. Acad. Sci USA, 91, 98-102.
Ptitsyn,O.B. and Volkenstein,M.V. (1986) Protein structures and the neutral theory of evolution. J. Biomol. Struct. Dynam. 4, 137-156.
Selvin,S. (1998) F distribution. In Armitage,P. and Colton,T. (eds.), Encyclopedia of Biostatistics , vol 2., John Wiley & Sons, Chichester, pp. 1469-1472.
Vingron,M. and Argos,P. (1989) A fast and sensitive multiple sequence alignment algorithm. CABIOS, 5, 115-121.
 ,
,
 ,
,  ,
,