EEI-Calculator
Methods and Algorithms
Genome
sequences
Local complementarity
index (LCI)
Elongation Efficiency Index (EEI)
Estimation of correlation between EEI and gene
expression
Acknowledgements
References
We developed an algorithm for estimating general translational characteristics of an organism using its genome sequence. The algorithm computes elongation efficiency index (EEI) in five different forms for each ORF. Computation is based on estimation of ORF elongation efficiency considering three key factors: codon bias, average number of inverted repeats within coding sequence, and free energy of potential stem-loop structures. The impacts of these factors on translation are numerically estimated.
EEI-Calculator allows to estimate whether gene expression in given organism is correlated with selection towards preferred codons (high M1) and/or selection against secondary structures (high M2,..M5). This knowledge may be useful in planning transgenic studies with recently sequenced unicellular organisms.
Introduction
Elongation is the most energy- and time-consuming stage of mRNA translation. Therefore, high level of gene expression requires high rate of elongation. In many unicellular organisms this is achieved by non-uniform usage of synonymous codons, with preferences for a subset of “optimal” codons in highly-expressed genes (Sharp and Li, 1987; Andersson and Kurland, 1990). The sets of preferred codons in such organisms have high relative concentrations of cognate tRNAs (Ikemura1985; Gouy and Gautier, 1982). Codon bias increases translation rate because preferred codons tend to be translated more rapidly than synonymous alternatives (Sorensen 1989; Kurland 1991). Translational codon bias is correlated with gene expression level in many prokaryotes and some eukaryotes (Ikemura 1985; Gouy and Gautier, 1982; Duret and Mouchiroud, 1999).
Though codon bias indices like CAI (Sharp and Li, 1987) are good predictors of gene expression in E. coli, B. subtilis and many other organisms, they are not useful for organisms which do not have strong translational codon bias. This set of species includes Helicobacter pylori (Lafay et al., 2000), Borrelia burgdorferi (Lafay et al., 1999) and others. In these species codon bias is not correlated with gene expression, and indices like CAI can not be applied to gene expression prediction.
This problem prompted the authors to consider the negative influence of RNA secondary structures on the rate of elongation (Likhoshvai and Matushkin, 2002). To estimate this influence, authors proposed to calculate the average number of local inverted complementary repeats within ORF, which may form local stem-loop structures.
Indeed, this approach revealed correlation between gene expression and translational index in those organisms where traditional codon bias indices like CAI do not work. The constructed elongation efficiency index (EEI) has five forms according to the included key factors:
1. codon
composition
2. number and
length of local hairpins
3. number,
length and energy of local hairpins
4. codon
composition + number and length of hairpins
5. codon
composition + number, length and energy of hairpins
According to their leading EEI forms, organisms were classified by five translational groups (Likhoshvai and Matushkin, 2002).
Methods
and Algorithms
Genome sequences
The flat file(s) of complete genome sequence in Genbank or EMBL format are uploaded by the user. The sequenced genomes may be found in NCBI GenBank FTP or EMBL. From each file coding sequences of genes longer than 30 codons, with 3’- and 5’-flanking regions of 600 nucleotides, are extracted.
Local complementarity index (LCI)
In order to estimate influence of local secondary structures on elongation efficiency, authors proposed a local complementarity index (LCI) in two forms.
In the first form (LCIL) the average number of self-complementary regions in a window of mi nucleotides is calculated according to the following formula:

In this computation we disregard
information about the energy of hairpins formed in mRNA. In the latter formula con(i,j) is the sequence of nucleotides
between the i-th and j-th nucleotides, and ![]() - denotes sequence that is complementary to nucleotide
sequence the j-th and i-th nucleotides (i £ j); and z(context1,context2) has value 1, if the words context1
and context2 are identical, otherwise
z(context1,context2)=0; i=1,..Ntot,
where Ntot is the total
number of extracted ORFs from the genome. The length of accountable inverted
repeat falls between smin
and smax; the distance
between accountable inverted repeats falls between lmin and lmax
(in this paper, we accept smin=smax=3,
lmin=12, lmax=85).
- denotes sequence that is complementary to nucleotide
sequence the j-th and i-th nucleotides (i £ j); and z(context1,context2) has value 1, if the words context1
and context2 are identical, otherwise
z(context1,context2)=0; i=1,..Ntot,
where Ntot is the total
number of extracted ORFs from the genome. The length of accountable inverted
repeat falls between smin
and smax; the distance
between accountable inverted repeats falls between lmin and lmax
(in this paper, we accept smin=smax=3,
lmin=12, lmax=85).
The LCIL(i) value has a meaning of the number of complementary nucleotides per one nucleotide in ORFi.
In the second form (LCIE) the average free energy of hairpin formed in the window of mi nucleotides is calculated with the following formula:

where y is an energy of the secondary structure, which is calculated conventionally (Turner and Sugimoto, 1988).
The LCIE(i) value has a meaning of average free energy of complementary secondary structures per one nucleotide.
Elongation Efficiency Index (EEI)
After calculation of LCIL(i) and LCIE(i)
indices for each ORFi, an iterative algorithm ranks ORFs according
to their EEI values (with all five EEI types). At the first step, a random
sample of Nsub=150 ORFs is chosen, and frequencies of all codons
are counted in it. According to the obtained codon frequencies, the EEI values are
calculated for all ORFs. The EEI(i) value reflects the relative average elongation rate of one codon in the ORFi:
EEI(i)=K/(w1Ta(i)+w2Te(i)), where K
is a scale constant, w1=(0 or 1), and w2=(0 or 1) are weight
coefficients.
The first term Ta
evaluates the codon bias. It reflects the mean time required for fixation of
isoacceptor aminoacyl-tRNA in the А-site of a ribosome as determined by codon
frequencies alone:
 ,
,
 , where the variable 1/bd(i,j) is interpreted as the optimal
relative concentration of cognate tRNA for the j-th accountable codon, while ad is a frequency of d codon in
reference sample of genes, and ni
is the number of codons in ORFi.
, where the variable 1/bd(i,j) is interpreted as the optimal
relative concentration of cognate tRNA for the j-th accountable codon, while ad is a frequency of d codon in
reference sample of genes, and ni
is the number of codons in ORFi.
The second term, Te(i), estimates the mean time required for translocation:
Te(i)= tmin (1-p(i))+tmax
p(i),
where tmin is a minimal, tmax is the maximal conventional times required for translocation, p(i) is the probability of realization of the maximal conventional time calculated by the following equation:
 , k=m/s2, n=(m/s)2, where m is the mean and s2 is the dispersion of positive random variable with distribution
density of
, k=m/s2, n=(m/s)2, where m is the mean and s2 is the dispersion of positive random variable with distribution
density of ![]() , and G(n+1) is
Gamma-function.
, and G(n+1) is
Gamma-function.
After calculation of EEI(i) (i=1,…,Ntot), all ORFs are ranked by EEI values, and next sample of Nsub ORFs with the highest EEI values is chosen. This procedure is cyclically repeated until the set of ORFs comprising the reference sample becomes constant. Usually it takes 10-15 iterations.
The number Nsub=150 sample ORFs was used from considerations of virtually constant number of house-keeping genes in unicellular organisms.
When the iterative algorithm is completed, all ORFs are again ranked by EEI values.
Weight coefficients w1, w2 have values 0 or 1, and LCI(i) may be of two types, LCIL(i) or LCIE(i), so there are 5 forms of EEI:
1) EEI1 (A), w1=1, w2=0, no LCI. Only codon bias is considered, and secondary structures are neglected.
2) EEI2 (LCIL), w1=0, w2=1, LCI(i)=LCIL(i). Codon bias is neglected. Only number and length of secondary structures are considered.
3) EEI3 (LCIE), w1=0, w2=1, LCI(i)=LCIE(i). Codon bias is neglected. Only number and free energy of secondary structures are considered.
4) EEI4 (A-LCIL), w1=1, w2=1, LCI(i)=LCIL(i). Both codon bias and number of secondary structures with account of their length are considered.
5) EEI5 (A-LCIE), w1=1, w2=1, LCI(i)=LCIE(i). Both codon bias and number of secondary structures with account of their energy are considered.
Estimation of correlation between EEI
and gene expression
To estimate correlation of EEI with gene expression levels we used the well known fact that ribosomal genes are normally highly-expressed in unicellular organisms. Hence, they may be used as markers to evaluate the ability of EEI to predict gene expression.
In each genome we marked genes involved in ribosomal subunits formation. This procedure is performed automatically by Perl-script, which recognizes and marks up the ribosomal genes using combinations of key words in gene annotation.
For each of five index types a pair of (M±R) is calculated, where M is the mean of positions of ribosomal genes among all genes ranked by EEI, and R is the standard deviation of positions:
![]() ,
, 
The (M±R) pair has a meaning of relative elongation efficiency of ribosomal genes.
As a result, we obtain five pairs of (M1±R1), (M2±R2), (M3±R3), (M4±R4), (M5±R5), which reflect the translational characteristics of the organism. Hereinafter pairs (Mi±Ri) are normalized within the limits of (-100<M<100) and (0<R<100) for convenience.
In Fig. 1 one can see a typical distribution of relative EEIi values of ribosomal genes. High relative elongation efficiency of ribosomal genes is observed here in EEI4. The criterion of high correlation between EEIi and gene expression is the closeness of Mi to +100 (and, in addition, low Ri). High Mi indicates that ribosomal genes have relatively high expression levels among other genes, and low Ri indicates that their expression is tightly correlated with each other.
Figure 1. Scheme of relative elongation efficiency distributions for ribosomal genes. Genes are ranked by EEIi, i=1,…,5.
High relative elongation efficiency is observed in EEI4.

The statistical
significance of Mi±Ri realization was
estimated using
Even in organisms with small total number of genes, the significance of Mi is very high despite the small sample size. For example, in Candidatus Blochmannia floridanus, with Nrib=54, Ntot=584, the mean M4=36 and standard deviation R4=53, the significance is p=10-6. For most genomes the statistical significance is even higher (p@10-8-10-12).
During the EEIi calculation we excluded short 5’- and 3’-regions of ORFs, because their codon composition may be biased due to initiation and termination effects. The length of excluded regions varied from 1 to 20 codons, and was determined by an algorithm of seeking the maximal M1 value.
The program output contains the following results:
General genome statistics
|
Nrib, number of recognized ribosomal genes |
|
Ntot, total number of considered ORFs |
|
L, length of the genome (Kbp) |
|
G+C composition (%) |
Translational characteristics
|
M1±R1 (codon composition) |
|
M2±R2 (number and length of local hairpins) |
|
M3±R3 (number and energy of local hairpins) |
|
M4±R4 (codon composition + number and length of l. h.) |
|
M5±R5 (codon composition + number and energy of l. h.) |
|
G, the translational group (number of the largest index M with smallest R) |
If the organism falls into group 1, its gene expression is correlated with selection towards preferred codons (high M1). In practice this means that replacing of suboptimal codons by preferred synonymous codons may increase transgene expression in the given host organism. The well known examples of such organisms are Escherichia coli and Bacillus subtilis.
Organisms that fall into groups 2 and 3 (low M1 and high M2, M3) have no strong correlation between gene expression and codon composition. In such organisms replacing of codons will unlikely result in higher gene expression. Instead, stable secondary structures should be minimized along ORF to enhance its expression.
Those organisms that fall into groups 4 and 5 (high M4 and M5) have both preferences in codon usage and selection against secondary structures. In transgenic design both these factors should be taken into account for increasing gene expression.
The values of the (Mi,Ri) pairs for some bacteria are shown in Table 1. The cumulative diagram of bacterial genome distribution over five translational groups is shown in Fig. 2. Most bacterial genomes fall into Groups 1 and 4.
Table 1. Relative elongation efficiency of ribosomal genes in some bacterial
genomes.
|
Genome |
Num of ribos. genes |
Num of all genes |
M1±R1 |
M2±R2 |
M3±R3 |
M4±R4 |
M5±R5 |
Group |
|
Escherichia coli K12 |
56 |
4234 |
92±23 |
25±64 |
28±57 |
79±37 |
65±53 |
1 |
|
Mycoplasma hyopneumoniae 232 |
48 |
691 |
-56±55 |
73±34 |
64±44 |
41±53 |
47±51 |
2 |
|
Nitrosomonas europaea |
55 |
2573 |
-52±60 |
18±67 |
63±47 |
-6±69 |
57±49 |
3 |
|
Borrelia burgdorferi |
53 |
848 |
-14±60 |
57±47 |
57±52 |
65±41 |
53±50 |
4 |
|
Pseudomonas putida KT2440 |
54 |
5350 |
74±26 |
60±33 |
67±27 |
86±17 |
92±13 |
5 |
-100<Mi<100, 0<Ri<100
(i=1,..,5) are normalized mean and standard deviations of ribosomal genes
positions among other genes ranked by EEIi values. The highest Mi with corresponding Ri (i=1,..,5) are highlighted.
Using the algorithm we have computed quantitative translational characteristics of 240 unicellular organisms (213 bacteria, 22 archaea, and 5 eukaryota). According to their leading group number, all studied organisms may be classified by five translational groups (see Fig. 2 for Bacteria and Archaea distributions).
Figure 2. Distribution of 213 bacterial
and 22 archaeal genomes over five translational groups.
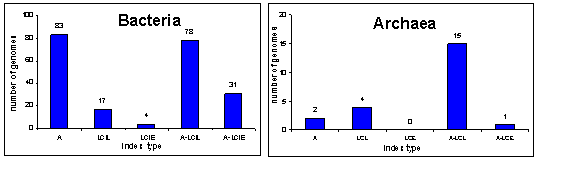
Legend: A – group
with preferences in codon usage, LCIL – secondary structures with account of
length, LCIE - secondary structures with account of energy, A-LCIL – codon
usage with secondary structures with respect to length, A-LCIE – codon usage
with secondary structures with respect to energy.
Acknowledgements
The work was supported by the Russian Foundation for Basic Research (No 04-01-00458, 05-04-49068, 05-07-90274, 06-04-49556), Russian Ministry of Industry, Science and Technology (No.43.073.1.1.1501), Siberian Branch of the Russian Academy of Science (project № 10.4), Integration Project № 119, and State contract № 10104-71/П-25/155-270/200605-056 and NSF:FIBR (Grant EF–0330786).
Authors: N. V. Vladimirov, V. A. Likhoshvai , Yu. G. Matushkin
Web-version: M.A. Genaev
Institute of Cytology and
Genetics SB RAS,
References
1. Andersson SGE, Kurland CG (1990) Codon preferences in
free-living microorganisms. Microbiol. Rev., 54: 198-210.
2. Carbone A, Zinovyev
A, Kepes F (2003) Codon adaptation index as a measure of dominating codon bias.
Bioinformatics, 19(16):2005-15.
3. Duret L, Mouchiroud
D (1999) Expression pattern and, surprisingly, gene length shape codon usage in
Caenorhabditis, Drosophila, and Arabidopsis. Proc. Natl Acad. Sci.
USA, 96(8):4482–4487.
4. Gouy M, Gautier Ch
(1982) Codon usage in bacteria: correlation with gene expressivity. Nucleic
Acids Res., 10:7055–7070.
5. Ikemura T (1985) Codon usage and tRNA content in
unicellular and multicellular organisms. Mol. Biol. Evol., 2:13–34.
6.
7. Lafay B, Atherton
JC, Sharp PM (2000) Absence of translationally selected synonymous
codon usage bias in Helicobacter
pylori. Microbiology, 146:851–860.
8. Lafay B, Lloyd AT,
McLean MJ, Devine KM, Sharp PM, Wolfe KH (1999) Proteome composition and codon usage in spirochaetes:
species-specific and DNA strand-specific mutational biases. Nucleic Acids
Res., 27:1642–1649.
9.
10.
Sharp PM, Li WH (1987) The codon adaptation index - a measure of directional
synonymous codon usage bias, and its potential applications. Nucleic Acid
Res., 15:1281–1295.
11.
Sorensen MA, Kurland CG, Pedersen
S (1989) Codon usage
determines translation rate in Escherichia coli. J. Mol. Biol., 207:365-377.
12. Turner DH, Sugimoto
N (1988) RNA structure prediction. Annu
Rev Biophys Biophys Chem., 17:167-92.