 , (1)
, (1)The aim of the analysis is to determine the positions or regions of aligned sequences where chosen physico–chemical or conformational feature variations depend on each other. Such dependence could indicate possible importance of these regions for functioning of the sequences and can point to possible molecular mechanisms of functioning of these regulatory sequences.
The method is based on traditional approach designed for pairwise correlation analysis of amino acid sequence samples [Neher E., 1994]. This method was modified for detailed analysis of compensatory substitutions of residues in positions of sequences referring to different protein families [Afonnikov D.A. et al., 2000].
For analysing aligned sample set of DNA site nucleotide sequences, we use conformational DNA properties calculated for nucleotide pairs [Ponomarenko J.V. et al., 1999]. We consider a set of N aligned sequences with the length L. In the process of analysis, each sequence is being re-coded into the sequence of nucleotides with the length L-1. Each dinucleotide is corresponded to a particular value of physico-chemical or conformational property f. Thus, we arrive at numerical matrix NxL-1. An element [l,m] of this matrix corresponds to the value of property f of a dinucleotide beginning at position m in the sequence l.
As the measure of dependency between the values of properties f in positions of the sample sequences, we take the value of correlation coefficient as follows:
 , (1)
, (1)
where xi is a property of a nucleotide starting at i– th position,
N is a number of sequences in a set,
dii is a sample variance of a property of a dinucleotide starting at i-th position.
Significant deviation of correlation coefficient from zero (that is, when it exceeds by modulo some limiting value rlimit.) means that there exists a statistical dependency for conformational property values at a pair of positions i, j. To determine rlimit. , we use the value
 , (2)
, (2)
which is distributed in accordance with the Student criterion with m = N-2 degrees of freedom [Anderson T.W., 1958].
For analysis of nucleotide sequences, the problems, related to determining of statistical dependencies in a set given, do not appear due to evolutionary interrelationships between the sequences [Afonnikov D.A. et al, 2000]. This fact simplifies an application of the method.
To reveal the blocks with significant prevalence of correlating pairs in the matrix it undergoes the procedure of clustering. The size of the blocks were chosen so that the number of pairs forming the square block should be essentially less than their complete number of pairs in the whole matrix. In order to determine statistical reliability of prevalence of correlating pairs in this block, we have used an approximation of binomial distribution. In this case, the probability p of event that the number of significant pairs in this block should exceed the observed value m equals to
,
where q is a probability of significant correlation for the whole matrix, n is the number of positions in a window.
Thus, this block was considered as significant if p < 1%, that is, this corresponds to significance level equalling to 99%.
Anderson T.W. (1958), An Introduction to Multivariate Statistical Analysis, John Wiley & Sons Inc., NY
Neher E. How frequent are correlated changes in families of protein sequences? Proc. Natl. Acad. Sci USA. 1994. 91. P. 98-102.
Ponomarenko J.V., Ponomarenko M.P., Frolov A.S., Vorobyev D.G., Overton G.C., and Kolchanov N.A., Conformational and physicochemical DNA features specific for transcription factor binding sites. Bioinformatics. 1999. 15, 7/8. P. 654-668.
BACK TO INDEX
How to use
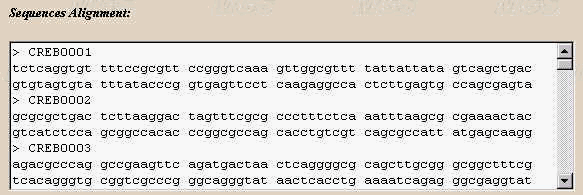
Enter the alignment to be analysed (in FASTA format) into the ‘Sequence alignment’ text-box
(the alignment can be extracted out of any DNA sequence alignment database like Samples. The sequence number should be at least 10. Note that accuracy of the method increases with sequence number. The sequences should be of equal length that should not exceed 130 bp. Gaps are forbidden, so positions of alignment that contain gaps will be eliminated from analysis).

2. Choose the conformational or physico-chemical property of DNA molecule
that you want to analyse in the ‘Dinucleotide property’drop-down menu:
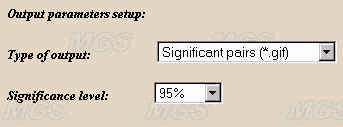
3.Choose the form of the output data display and significance level in the ‘Output parameters setup’ menus:

4. Type the number in the range 1-20 in the text-box ‘Window size’ to choose the size of window for clusterisation process:
Numbers between 3 and 10 recommended
5. Click ‘Submit button’ to display the results automatically.
BACK TO INDEX
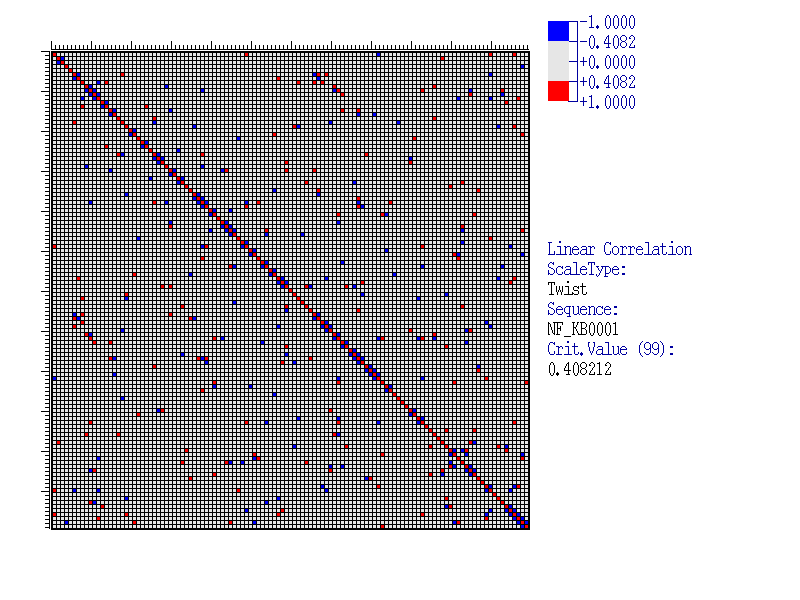
Let us consider an Example of the program execution for alignment of 39 sequences of NF-kB transcription factor binding sites (available in SAMPLES database), with the sample length of 120 nucleotides. As the property analysed we take Twist(Averaged for X-rays). Results
| This figure exemplifies the matrix of correlation coefficients of the Twist(Averaged for X-rays) values for a sample of 39 sequences of NF-kB sites. Insignificant correlations are marked grey, significant are coloured. The value scale is shown in the top right corner. The critical value is calculated according to equation (2)(link to METHOD OVERVIEW) at a 99% significance level: |
 |
| As seen, this matrix has both isolated elements corresponding to the pairs of significantly correlating positions and the clusters of such elements. To reveal such clusters (blocks), the clusterisation method could be applied (see Method overview). By clicking the hyperlink ‘Clusterization results’, the results of the program execution are displayed. |
|
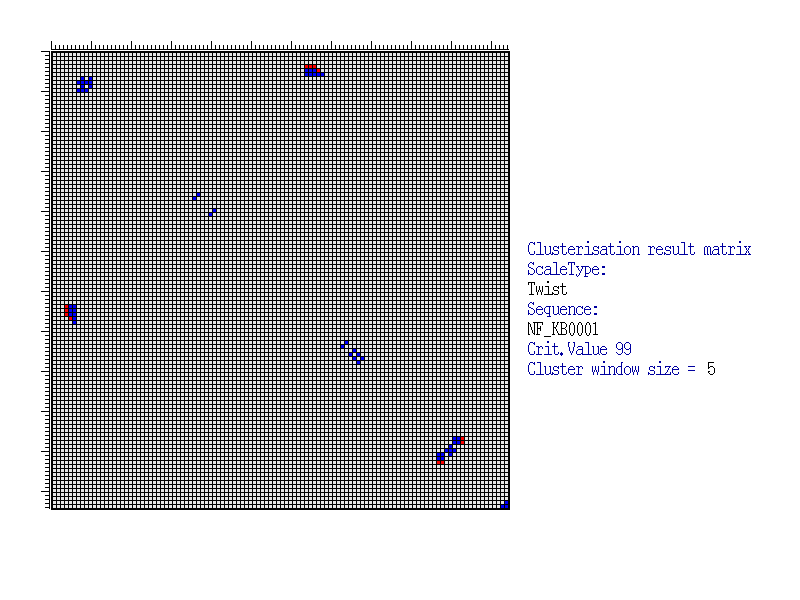
This Figure illustrates positioning of significant blocks in correlation coefficients matrix calculated for Twist (Averaged for X-rays) property values for NF-kB sites. By X- and Y-axes, positions of clusters are marked. The value of correlation coefficient significance is estimated by the formula (2) under the confidence level of 99%. Clusterisation was made for the window with the size 5x5 and confidence level of 99%, calculated by the formula (3). The blocks are marked by colour. Red colour corresponds to the centre of significant block, where the number of positively and significantly correlated pairs exceeds the number of negatively and significantly correlated pairs. In other case, the centre position of significant block is marked by blue. |
 |
| Thus, it is possible to detect the sequence regions that could be important for functioning of regulatory regions as well as relationships of these regions to each other. For example, as seen from the Figure, the cluster located in the upper central part indicates that the left flank of the site (positions 4-6) is related to the site centre (positions 74-79) according to the Twist property value. Thus, for the proper site functioning, there are functional restrictions for nucleotide content of the sequence in this regions. |
BACK TO INDEX