|
ANALYSIS OF PAIR POSITIONALCORRELATIONS[Tutorial page]
|
|
|
| To consider multiple alignment of protein sequences
of the "homeodomain" family. To determine pairs and groups of protein positions that are substituted co-adaptively with respect to isoelectric point values of amino acids. |
|
| Open new browser window of the pairwise correlation analysis CRASP page. This
will be your CRASP package working window. Use it in parallel with this tutorial
window. Open new browser window at Result example
page to retreive the data from test analysis by the example of homeodomain analysis. Note. In this example, the robustmness of correlation coefficients was additionally estimated. This estimation has revealed that a part of significant correlation coefficients is unstable, hence, they were excluded from consideration. That is why the results of clusterisation of positions shown in 'Result example page' differ from results obtained without accounting of robustness. The description of analysis, methods and algorithms could be obtained here. |
|
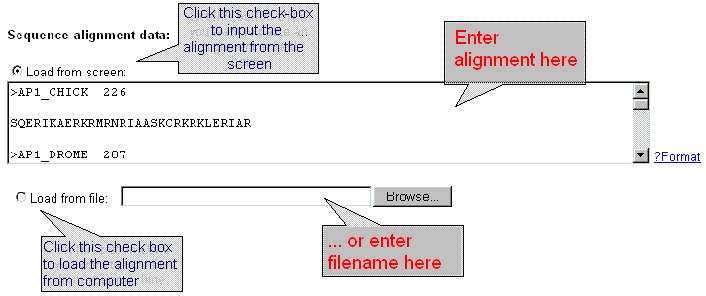
| Enter the sequence alignment data in FASTA format into the 'Sequence data' field or download the sequence data from file by using dialog window 'Load from file'. Click the button 'ON' and input the file name into the text field. |
 |
Your
actions with the working window:
|
|
| Select the parameters of calculation. |
 |
| Select physico-chemical residue's characteristics from the 'AminoAcid
quantity' menu, which contains 36 properties.
Important note: this option is valid if 'AAindex number' field contains zero value. |
 |
| You may select one of more than 400 characteristics from AAIndex database (see details). Type the database entry number. |
| Select the type of calculated matrix (see details). |
 |
| Specify the variability threshold (number of different amino-acid types in alignment column) in order to exclude low-variable protein positions. |
| Two parameters are introduced to modify the notation of alignment position in output data. Specify in the field 'Selected sequence #' which sequence of the alignment should be a reference sequence. Specify in the field 'First AA number' the ordinal number of the first position in the reference sequence. |
 |
| Your actions with the
working example window: Set the following calculation parameters:
|
|
| Sometimes it is necessary to apply data weighting. CRASP package realises several standard schemes of data weighting. Also, a user may enter other weights for all sequences. Data weighting is set in the fields below. |
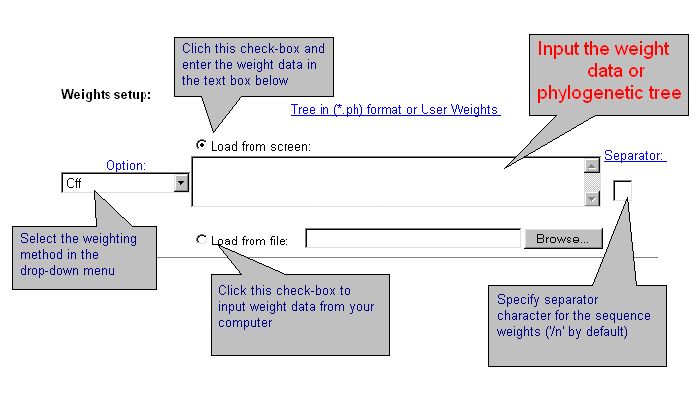 |
| Current version of CRASP applies several weighting methods. Select one of them or the option without weighting 'Off'. By choosing 'User defined' weights, enter weight values for each sequence that should be divided by symbol-separator (by default - ;). You may introduce your own symbol-separator, specified in the text-box 'Separator'. By using the weights by Altschul et al. and Felsenstein, enter the phylogenetic tree in *.ph format or load it from file. Details are here. |
 |
Your actions with the
working window:
|
|
| Choose the format of the output correlation matrix data and supplementary information. |
 |
| Correlation matrix output is possible in four formats. Choose one of them. In the text format, the matrix is represented as a table with numerical values. In HTML format, the table cells are coloured in accordance with significance level of correlation coefficient. In GIF format, the matrix is displayed as a colored diagram with "cartographic" palette (blue-green-red) and a diagram of significant pairs (see details) |
 |
| Choose the significance level for correlation coefficient out of 4 possible modes (see details). These values will be listed in the resulting page. For HTML format of correlation matrix and 'Significant pairs' format, the significant coefficients will be marked by blue and red colors for negative and positive values, respectively. |
 |
Your actions with the
working window:
|
|
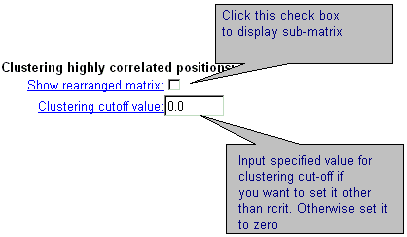
| A seria of additional options enables to display GIF-image for sub-matrix of correlation coefficients ęîđđĺë˙öčč for positions from significantly correlating clusters. If '0.' is entered in the field 'Clustering cut-off value', then the threshold equals to critical value of correlation coefficient (see details). |
 |
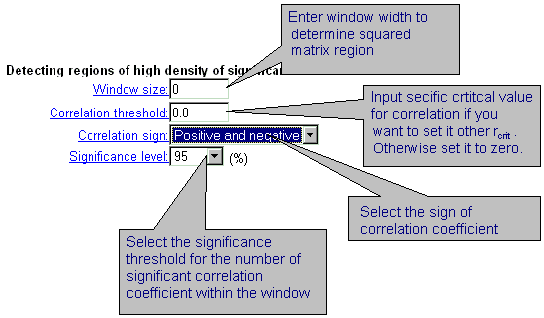
| By displaying output results, it is possible to detect the regions of correlation matrix with prevailing number of significant correlation coefficients. these are square sub-matrices of user defined size. If the number of significant correlation coefficients in this square window exceeds some critical value ordered by user, these regions are marked by blue. This search could be done respectively the sign (positive, negative, or both) of correlation coefficient. |
 |
| Your actions with the
working window: In the field 'Clustering highly correlated position'
In the field 'Detecting regions of high density of significant correlation'
|
|
| To RUN CRASP click the button 'Execute': |
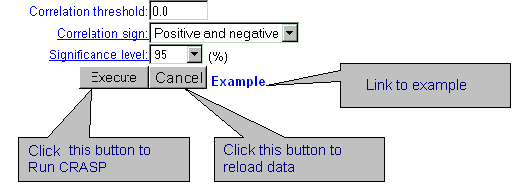 |
Your actions with the
working window:
|
| The result page will be displayed automatically. |