ABOUT
SITECON - is a program pakage for revealing and analysis of
conservative conformational and physicochemical properties in
transcription factor binding sites sets. It contains the knowledge
base of conservative properties for over 100 high quality samples of
sites. Also resource contains tool for recognition of potential binding
sites basing on the data about conservative properties of the site
in genomic sequences proposed by user.
Data about used context-dependent
conformational and physicochemical properties is available in the
PROPERTY Database
Justification
The increasing volume of experimental data suggests that the local
conformation of transcription factor binding sites determined
by their context is a factor responsible for specificity of DNA-protein
interactions. This suggests that certain conformational and physicochemical
properties of the variants of genomic sequences interacting with a certain
regulatory protein should be preserved. Analysis of the local conformations
and properties of the aligned set of functional DNA sequences allows the
conservative context-dependent conformational and physicichemical properties
to be determined. A set of conservative properties, specific of sites for
binding a particular transcription factor can be effectively used for site
recognition and/or analysis of molecular mechanisms of particular protein-DNA
interactions (Oshchepkov D., et al., 2004).
Tutorial
STEP 1.
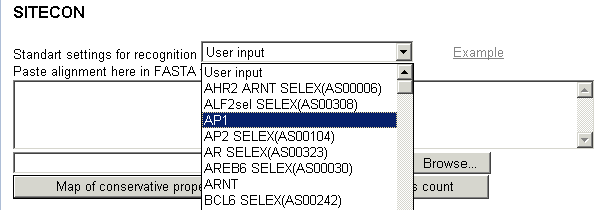
Stage 1. Select one of transcription factor binding
sites (TFBS) from the list,

or paste
your own TFBS alignment (in FASTA format) into the box (choose "User
Defined" in "Standart settings" box):

or choose
the file with your own TFBS alignment in FASTA format from you local
disk

Stage 2. Input the DNA sequence where you want
to reconize this particular TFBS:
Paste it or choose the file (all in
FASTA format)

To see the
recognition errors press button "Recognition errors count" To
see the map and table of conservative conformational a physicochemical properties
press button "Map of conservative properties"

Stage 3.
Choose parameters for recognition. When using predefined settings (see
Stage 1)
parameters are fixed at optimal values, choose only threshold
parameters.

"Minimal
threshold" and "Cut threshold" Threshold (see "Method
overview" for details) is less then 100%. Choosing too low threshold
will lead you to recognition of too many TFBS recognised with too low
trustworthiness. Choosing too high threshold will lead to no TFBS
recognised. For each threshold the matrix of errors (Type I -False
Negatives percentage and Type II - False Positives percentage) is
generated after submission. Choose minimal threshold not less than 60, you
will be able to choose the appropriate optimal for your aims "Cut
threshold" which could be not less then "Minimal threshold"
after submission.
"Window size" must be not less than the
consensus sequence for this particular site and not more than TFBS
alignment length. Optimal is to choose this parameter a bit less then the
alignment length, but not more then 50.
"Apply weight"
(optional) in most cases applying no weight will fit. In some cases
choosing algorithm 1 or 2 will increase the recognition quality.
In cases when any algorithm (1 or 2) is choosed, selection of
most informative parameters is executed. This may lead to recognition
quality increase.
Stage 4. Determine if all of the parameters are
correct and press"Recognition" button to view results
STEP
2.
Results are as those

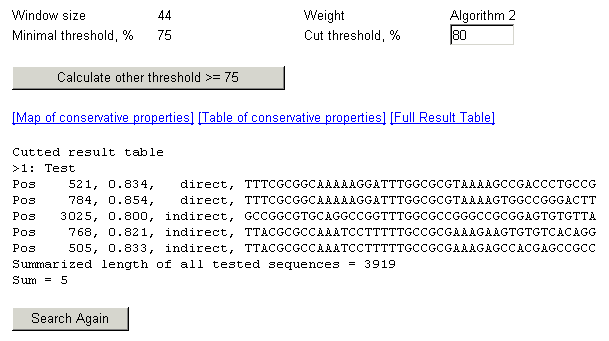
1. At the bootom of the page results are displayed, one
line for each potential TFBS, data in following order:
First colomn - position in the test sequence where potential TFBS is
recognised,
-
Second colomn - score value (which must be higher then threshold
value), which reflects the level of required conformational
similarity (see "Method overview" for details)
-
Third colomn - orientation of TFBS shows whether it was found on direct
or complementary (indirect) DNA chain.
-
Fourth colomn - the sequence which is decided to contain potential TFBS
(part of tested sequence containing potential TFBS)
Sum value at the bootom of the page shows the amount of
potential TFBS recognized for this threshold value. Summarized length
of all tested sequences shows the overall length of the DNA sequence(s)
in which the TFBS recognition was executed.
2. On the top
of the page previously choosed parameters are displayed. You can choose
new value for "Cut threshold" and results for this threshold will
be displayed immideately after pressing the "Submit" button without
new calculation.
3. Under the parameters block one can find links
to:
-
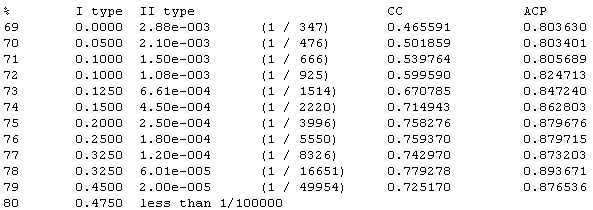
Error table HTML page:

Parameters used
to evaluate recognition quality for each threshold value are shown (see
Bajic, et al. for guidance). Error values, CC, ACP etc. values are
shown with accordance to each threshold value.
-
Error plot .gif image
Grafical represenation of the error
table.
-
Map of conservative properties Matrix where significantly conservative
conformational and physicichemical properties determined for the alignment
analysed are shown in graphical representation (see "Method
overview" for details)
-
Table of conservative properties Page where numerical values of
average and standard deviations of each property at positions of the alignment
are shown.
-
Full result table
Result table for minimal threshold (may be
too long)
References:
[1] Oshchepkov,D.Yu., Turnaev,I.I., Pozdnyakov,M.A., Milanesi,L., Vityaev,E.E.,
Kolchanov,N.A. (2004) SITECON- A tool for analysis of DNA physicochemical
and conformational properties: E2F/DP transcription factor binding site analysis and recognition.
In N.Kolchanov and R.Hofestaedt (ed.), Bioinformatics of genome regulation and structure.
Kluwer Academic Publishers, Boston/Dordrecht/London, pp.93-102.
[2] Bajic,V.B. (2000) Comparing the success of different prediction software in sequence analysis:
a review. Brief Bioinform. Sep;1(3):214-28.
|


